
Paradigm Shift: “Made in Europe” or “Made with Europe”?
European industry is facing an unprecedented shock. The automotive industry, batteries, industrial equipment, chemicals are now directly targeted. In a ground-breaking analysis, the Haut-Commissariat à la Stratégie et au Plan documents, for the first time, the scale of a major change, measuring Europe’s exposure to Chinese competition in both export and domestic markets sector by sector and country by country.
To protect its strategic industries from China, Brussels is preparing to break a taboo: the local content requirement.
There is a fierce battle within the Union between the strict “made in Europe” approach and the more flexible “made with Europe” approach.
Some European countries express their reservations in the name of economic liberalism. “We must be competitive through product quality and innovation, not by trying to protect European markets,” is the opinion of Swedish Prime Minister Ulf Kristersson.
The German chancellor, however, would prefer a product that is “made with Europe” rather than “made in Europe.”
The Japanese Honda Group supports expanding “made in Europe” to include “components from countries that share the same values, which would be considered locally produced content in Europe,” arguing that this would “support European objectives” for the electrification of the sector and help increase the industry’s resilience to overcapacity among Chinese manufacturers.
The United Kingdom and Turkey are also lobbying for this approach.
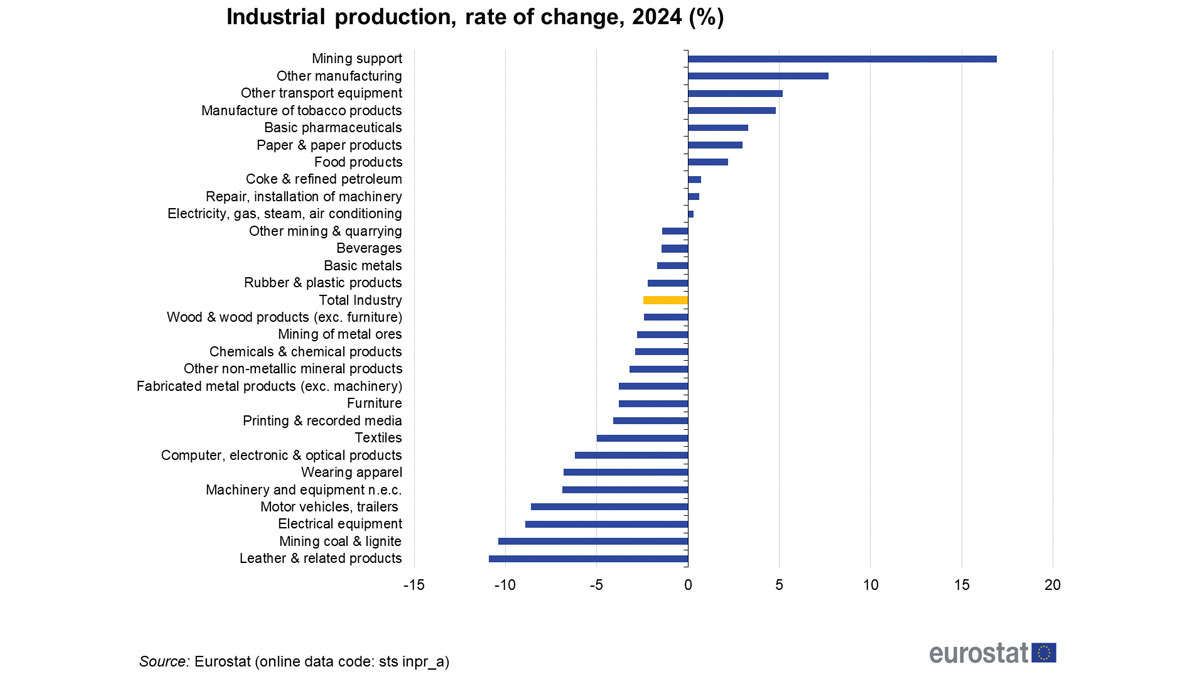
The end of the year showed the real picture of a weaker industrial Europe
The strongest sectors in the major European economies (Germany, the United Kingdom, France, Italy, and the Netherlands), as well as in other EU countries, experienced a decline in industrial production in December 2025 compared to the previous month.
Surprisingly or not, Poland saw the biggest increase among EU countries, while Bulgaria saw the biggest fall.


Romania has been on a downward trend. Romanian industrial production fell by 0.9% in 2025 compared to 2024, as a gross series, according to data published by the National Institute of Statistics (INS). The causes? Mainly the contraction of production in the manufacturing and extractive industries.
More concisely, according to EUROSTAT data, in the eurozone, the decline was 1.4%, while the EU recorded a smaller decline of 0.8%.
2025 – Average annual growth of industrial production
Looking back to December 2024, industrial production in the eurozone countries recorded a 1.2% increase, while in the EU countries there was a higher increase, of 1.4%.
Throughout 2025, both the euro area and the EU area recorded an average annual increase of 1.5% in industrial production compared to 2024.
Production by various categories
Analysis of production by category shows some differences even within the same segment. In December 2025, the euro area recorded declines in intermediate goods (-0.1%), energy (-0.3%), and capital goods (-1.9%). In contrast, durable consumer goods rose slightly, by 0.2%, while non-durable consumer goods fell by 0.3%.
Intermediate goods recorded a slight increase (0.1%), while energy production fell by 0.4%. Capital goods also fell, this time by 1.4%. Both durable and non-durable consumer goods grew by 0.5% and 0.6% respectively in the EU.
Variations in industrial performance between EU Member States
Variations in industrial performance were also observed between Member States. Slovakia (-4.9%), Germany (-2.9%) and Spain (-2.6%) recorded the biggest monthly falls.
By contrast, Luxembourg (+6.4%), Sweden (+4.4%) and Malta (+4.2%) recorded the most significant increases.
Capital and intermediate goods up, energy production down
Compared with December 2025 and December 2024, the euro area recorded an increase in intermediate goods (1.5%) and capital goods (4.1%). However, energy (-0.7%), durable consumer goods (-2.4%) and non-durable consumer goods (-2.1%) recorded declines.
The EU followed these trends to some extent, with increases in intermediate goods (1.9%) and capital goods (4.5%). However, the EU recorded larger declines in energy (-1.3%), durable consumer goods (-1.8%), and non-durable consumer goods (-2.0%).
The annual performance by Member State shows that Poland had the biggest increase and Bulgaria the biggest decrease in industrial production.
Among Member States, Poland (+6.9%), Sweden (+4.8%) and Croatia (+4.5%) recorded the highest annual increases. By contrast, Slovakia (-8.5%), Luxembourg (-7.9%) and Bulgaria (-6.8%) recorded the biggest falls.
Romania’s industrial production in 2025: Annual decline, but mixed signals at the end of the year
In 2025, compared to 2024, industrial production (gross series) decreased by 0.9%, as a result of declines in manufacturing (-1.2%) and mining (-0.9%). The production and supply of electricity and heat, gas, hot water, and air conditioning increased by 1.2%.
Industrial production in Romania fell by 0.9% in 2025 compared to 2024, as a gross series, according to data published by the National Institute of Statistics. The decline was caused by a contraction in manufacturing and mining output.
On the other hand, the production and supply of electricity and heat, gas, hot water, and air conditioning increased by 1.2%.
Sharp decline in December for the gross series, slight increase for the adjusted series
At the end of the year, in December 2025, industrial production (gross series) fell by 10.1% compared to the previous month, due to declines in manufacturing (-13.5%) and mining (-0.1%). The production and supply of electricity and heat, gas, hot water, and air conditioning increased by 7.9%.
Energy industry, on the rise, manufacturing and mining sectors, in decline
Industrial production, adjusted for the number of working days and seasonality, was 0.8% higher than in the previous month, due to increases in manufacturing (+1.2%) and mining (+0.8%). The production and supply of electricity and heat, gas, hot water, and air conditioning decreased by 2.6%.
Compared to the same month last year, industrial production (gross series) increased by 1.5%, as a result of increases in three industrial sectors: mining (+2.7%), production and supply of electricity and heat, gas, hot water, and air conditioning (+2.2%), and manufacturing (+1.2%).
Industrial production, adjusted for the number of working days and seasonality, was 1.6% higher than in the same month of the previous year, supported by increases in mining (+2.9%), production and supply of electricity and heat, gas, hot water, and air conditioning (+2.8%), and manufacturing (+1.1%).
In 2025, compared to 2024, industrial production (gross series) decreased by 0.9%, as a result of declines in manufacturing (-1.2%) and mining (-0.9%). The production and supply of electricity and heat, gas, hot water, and air conditioning increased by 1.2%.
The forecast for Romania’s industrial production in 2026 shows a recovery thanks to the defense industry.
BCR’s estimate for 2026 is an increase in industrial production of +1.9%, but with a risk of decline, marking the first year of recovery after three years of decline.
The growth engine is represented by significant investments in EU security, along with Germany’s extensive spending on infrastructure and defense, which will stimulate European industry in 2026.
If we talk about the PMI-BCR Romania index for the manufacturing industry, it fell slightly in January to 48.1, compared to 48.9 at the end of 2025, which means an accelerated decline in industrial activity, below the threshold that separates contraction from expansion for the 19th consecutive month. Except for production volume, which showed a relative improvement, all other components made a negative contribution in January.
Manufacturing output, weaker expectations
The use of factory production capacity continued to be well below the long-term average, according to BCR economists, thus confidence in the manufacturing industry declined, reflecting weaker expectations regarding production.
Exports with Germany in positive territory! External confidence indicators, on the rise
External demand continues to be a key factor for Romania’s domestic production volume.
About 20% of Romania’s exports go to Germany. The industrial component of the Ifo index (on the business climate for Germany), rose sharply in January compared to December 2025. Thus, companies perceived the current business conditions as more favorable. Expectations in the business community have become more optimistic. The reality, however, is slightly different, as capacity utilization has declined slightly and remained below the long-term average.
The PMI index for Germany’s manufacturing industry rose to a three-month high in January 2026, at 49.1, from 47.0 in December 2025, when the index hit a 10-month low.
Strongest sectors in Romania’s economy
Romania’s industry accounts for 25% of GDP and 75% of exports. It is a major economic pillar, dominated by the automotive sector, followed by energy production, metallurgy, and the chemical industry.
Main industrial sectors
- Automotive industry: the main segment, strongly integrated into European supply chains
- Energy industry: extraction and processing of oil, natural gas, and coal
- Metallurgy and steel industry: the plants in Resita and Hunedoara have a long tradition, although production has fallen dramatically since 1989.
- Chemical and pharmaceutical industry: developed in various regions
- Manufacturing industry: includes the wood industry, furniture production, textiles, and construction materials.
Romania ranks sixth in the European Union in terms of car production, alongside countries with over 100 years of experience in this field.
In addition to the automotive industry, Romania has a strong food industry, construction materials production—in the context of an infrastructure boom, with many highways under construction—and, last but not least, the IT&C sector.
Strongest sectors in Europe’s major economies
Germany – strong economy, skilled workforce and central location in Europe
Germany offers access to a large consumer market and advanced manufacturing capabilities. Many American companies, particularly in the technology and automotive sectors, have a presence in Germany.
The sectors that contribute most to Germany’s economic strength include the automotive industry, machinery and engineering, the chemical industry, information technology, and renewable energy.
UK – one of the most globalized economies in the world
The UK has traditionally been a top choice for US companies because of its large consumer market and English-speaking population.
Key sectors that contribute significantly to the country’s economic strength include financial services, retail and consumer goods, aerospace and defense, technology, and digital industries.
France – aerospace, luxury goods, technology and tourism
France has a diverse and robust economy, with sectors such as aerospace, luxury goods, technology and tourism offering attractive opportunities.
The sectors that contribute most to France’s economic strength are aerospace and aviation, luxury goods, pharmaceuticals and healthcare, the automotive industry, tourism and hospitality.
Italy – country with a developed industrial north and less developed agricultural south
Italy has a diverse economy with several strong industries and markets.
The sectors of major importance to Italy’s economic power are fashion and luxury goods, automotive and engineering, food and beverages, design and furniture, machinery, and industrial equipment.
The Netherlands – open gateway to the European market
The Netherlands is often seen as a gateway to the European market due to its strategic location, excellent logistics, advanced infrastructure, and business-friendly environment. It attracts many US companies from a wide range of industries, especially technology and logistics.
The sectors that contribute most to the Netherlands’ economic strength include agriculture and horticulture, high-tech manufacturing, chemicals and pharmaceuticals, logistics and transport, renewable energy and sustainability.